Our eMission
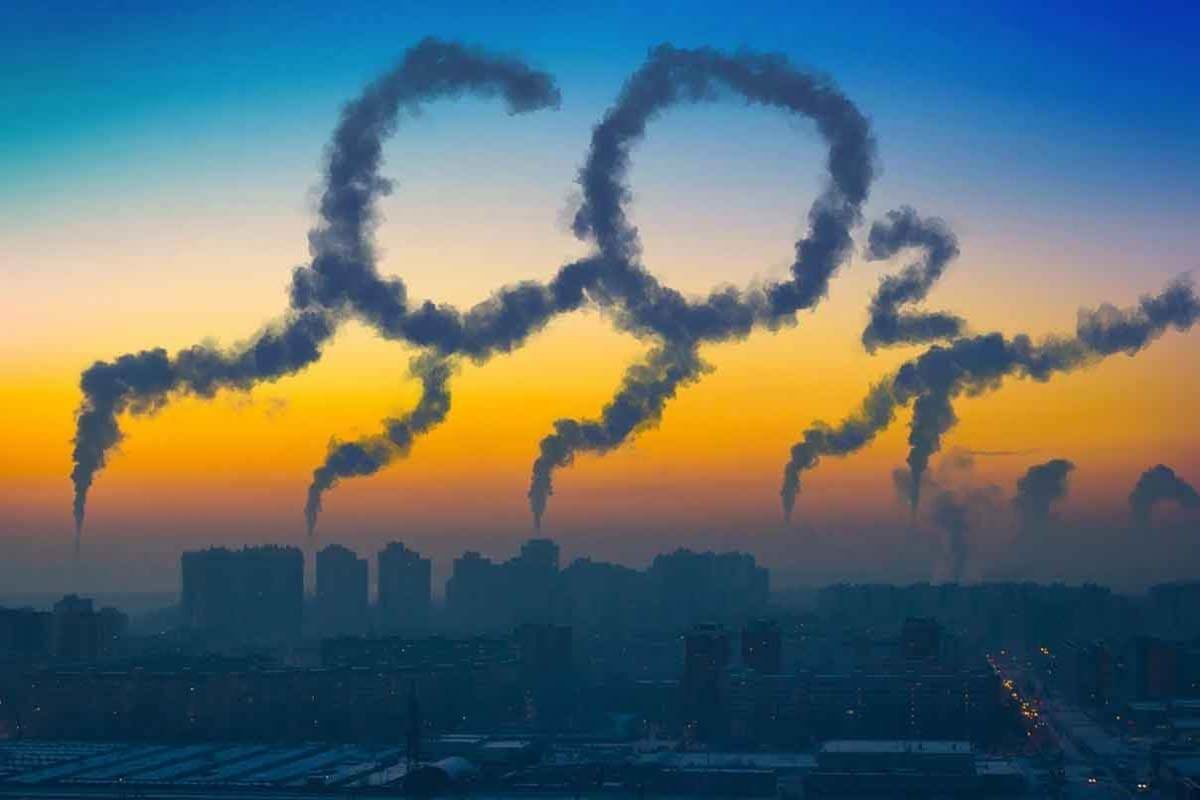
For our mission, we chose to investigate and attempt to predict greenhouse gas (GHG) emissions based on their relationship to import, export, and production rates of different fossil fuels. Given recent events surrounding fossil fuels (e.g., embargoes and skyrocketing prices), we felt that this was an extremely topical and relevant project to pursue. Our hypothesis was that GHG emissions are positively related to fossil fuel production, import, and export volumes. This, however, has been well studied and proven in the past, so we were also interested in understanding the nuances of the relationship at a deeper level.
Dataset
For our project, we utilized data sourced from the UN Data API. We collected data on import, export, and production volumes for five different fossil fuels (Motor Gasoline, Hard Coal, Crude Oil, Natural Gas, and Gas Oil/Diesel Oil) in correlation with GHG emissions for the same period. Data was collected for all available countries, ranging from the year 1990 to 2019.
One drawback with this API is that its data is self-reported to the UN by member nations/states. This method of data collection inherently causes some issues, as nations may not report or misreport some values. In addition, certain nations simply do not have the infrastructure to accurately report all values. Due to these characteristics, our team needed to perform missing value analysis and handling, so that accurate machine learning models could be trained. To do this, rows (individual datapoints) missing more than five values were removed from the dataset.
Prior to this adjustment, our dataset had 1290 rows and 7159 missing values, and afterwards contained 816 rows, with the number of missing values reduced to 1486. Although the number of missing values was reduced by approximately 80%, the number of rows only decreased by about 30%. This shows many of the missing values belong to the same rows, as countries that lack the infrastructure to report some values are also likely to lack the infrastructure to report other values as well.
Following this drop, columns (categories of fossil fuel imports, exports, or production) still containing a large portion of missing values were also removed, resulting in 293 missing values. To fill in the final few missing values, an imputer was used. This replaced missing values with the mean value for their column.
Visualizations and Graphs
Below are some of the graphs made to visualize trends and help our team better understand relationships in our dataset.
Above, a correlation heatmap is used to visualize how strongly related each of our feature variables (columns) are to one another as well as their relationships to GHG emissions (our target variable aka mission target aka eMission target). Higher values show a stronger correlation between variables, and here, the production of fossil fuels is much more closely correlated with GHG emissions than imports or exports. Additionally, production values are more highly correlated with one another than exports and imports are. From this, we can infer a country's production of fossil fuels is much more highly related to its energy demand than imports and exports.
By comparing the share of global greenhouse gas emissions of
1999, 2009, and 2019, it is observable that there has been marginal
change in which nations emit the highest amount of gasses such
as carbon dioxide, methane, and nitrous oxide. Particularly for
post-industrial and industrial nations (United States, EU
countries, Russia, Japan) this has consistently been the trend
for the last 20 years.
This also highlights a few of the limitations of the
dataset we are using. For example, China is not included in
this dataset although it is known to be a large contributor to global emissions.
In the second graph (a violin plot), we can see the distributions of how countries contribute to global greenhouse gas emissions. This graph shows that although there are a few countries which contribute disproportionately, most nations contribute a much smaller amount.
The hard coal production of the US has declined steadily since 1990, and their Greenhouse Gas Emissions have also decreased over that time. Meanwhile, Russia and Australia, two nations that have greatly increased their hard coal production have seen a large increase in their emissions over the same time, highlighting the trend that emissions are highly correlated with the hard coal production of a nation, as seen in the heatmap.
During the '90s, Russian crude oil production decreased
significantly. Then, from 2000 to 2004 their production rates
soared. Ever since, their production rates have continued to
increase at a slightly slower rate.
Similarly, American crude oil production declined steadily
from 1990 until the 2000s. Then, following the 2008 recession,
American crude oil production picked up, with production rates
soaring and steadily growing to present day.
Otherwise, following the year 2000, most other UN countries (with the
exception of Canada) have experienced a general decline in
crude oil production. This shift may be the result of
increased regulation, a shift to other fuels, or an increased
reliance on Russian or US crude oil export.
Machine Learning
Brief overview of machine learning process
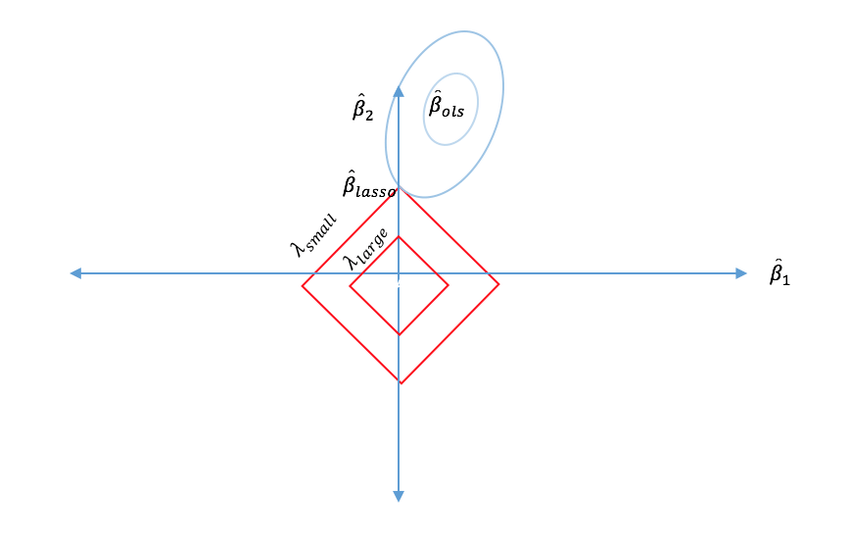
Lasso
Lasso Regression is a supervised machine learning model that uses L1 regularization to penalize weights of uninformative features by forcing them to be 0. This is in contrast with Ridge Regression which uses L2 to complete the same function. After training the model on our data, we found that there were better models that proved to be more accurate in comparison. After hyperparameter tuning using GridSearchCV, it was found that the alpha had the greatest impact on the accuracy of the model. With an alpha of 0.0001, our resulting model produced an MSE of 4.58772e-04 and an r2 of .9908.
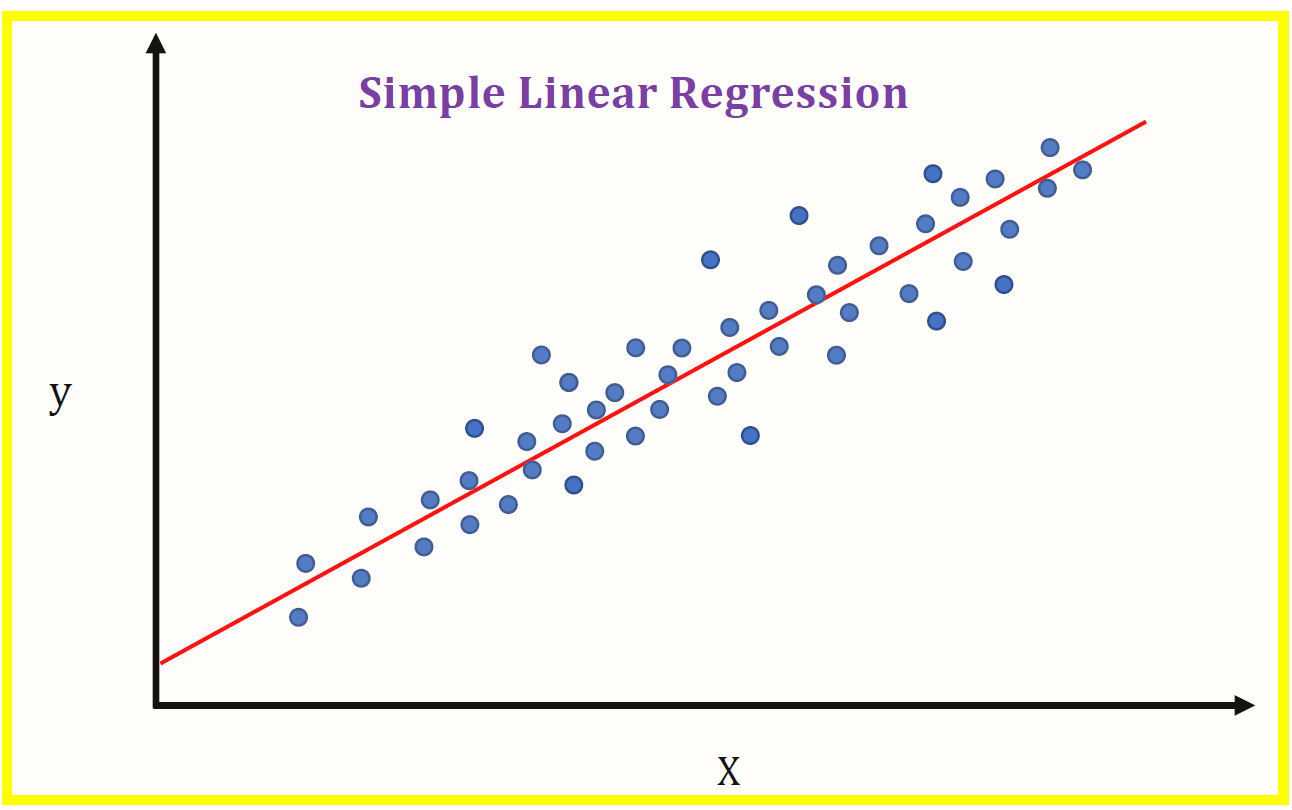
Linear Regression
The linear regression model is an example of supervised machine learning. It utilizes independent variables (input features) to predict the dependent variable (target variable) by creating a special linear line. This is the line of best fit, where the residual (error) between the actual values and the predicted values are at their lowest. In our application of the model, we received a mean squared error of 4.44938e-04 and an r2 of 0.98083.
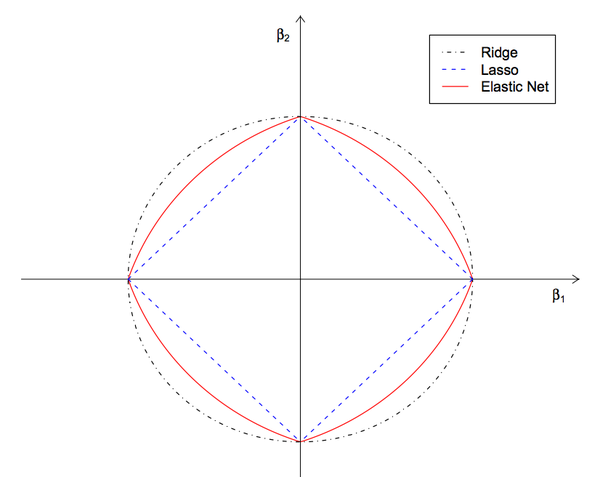
Elastic Net
In essence, Elastic Net is the intersect between a Lasso and a Ridge regression. Normally, a Lasso model will tend to rely on a single variable, simply removing variables it deems unnecessary, while a Ridge model will shrink a variable's weight to near epsilon. Elastic Net integrates both of these techniques and is useful when handling data with millions of parameters. After fine tuning this model, we achieved a mean squared error of 3.85498e-04 and an r2 of 0.98269.
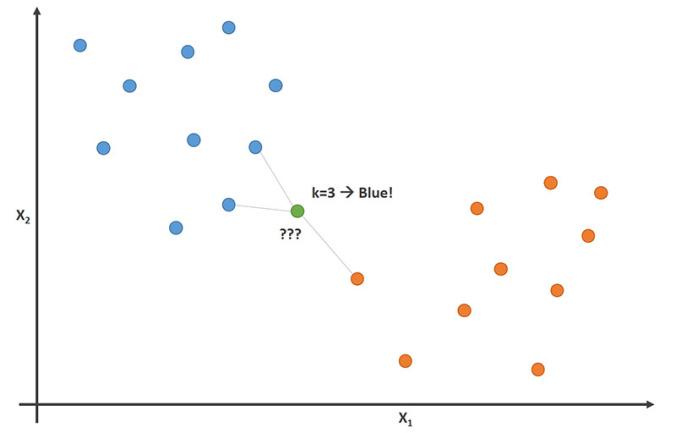
K-Nearest Neighbors (KNN)
K-Nearest Neighbors (KNN) is a supervised machine learning model that uses the distance between nearby points to make predictions. For the input, the k nearest points are taken where k is a whole number. The output is the average value of these points. The hyperparemeters we tuned for this model are the k value and the weights. Using GridSearchCV, we found the best value for k to be 2 and the best weighting to be distance. Using these hyperparameters, we got an MSE of 6.089e-05 and an r2 of 0.9964

Neural Net
Neural networks, based on the human brain, are particularly useful for detecting complex patterns in data other, more basic, machine learning methods may miss. They are comprised of layers that are connected in a series. Each layer is comprised of individual nodes that take in values and perform calculations with them before passing the output value to the nodes in the next layer. At the end of a network, there is an output layer containing nodes with values for the target variable. After fine tuning this model, we achieved a mean squared error of 7.5235e-05 and an r2 of 0.99769.

Random Forest
The Random Forest model for machine learning is based on a structure known as a Decision Tree. Decision Trees take data and classify it by running through a series of decisions, with each branch representing a different outcome. You continue to follow the tree until there are no more decisions to be made, at which point you reach a leaf, which is a final conclusion regarding the data. A Random Forest model uses a multitude of randomly generated Decision Trees (hence the name, Random Forest) simultaneously on the same datapoint and averages the leaf responses of each tree to reach a final answer. It is often considered superior to a single Decision Tree model because it uses a large sample of trees to increase precision and zero in on a target value. After fine tuning this model, we achieved a mean squared error of 1.59235e-05 and an r2 of 0.99906.
Results
Above is a visualization of the results for our six different machine learning models that have varying degrees of accuracy in their predictions. From our dataset, Greenhouse Gas Emissions (GHG) was chosen as the target variable, which left us with 10 different feature variables (imports, exports, and production of different energy sources) to see which had the greatest impact and correlation to GHG Emissions. Since we are trying to predict a value which we have some known samples of, a supervised machine learning model best fit the goals that we set out on this project. Different forms of regression were used as we wanted to predict a continuous value, and we were unsure of which model would perform best. Of the models we used, the two that produced the most accurate predictions were the Random Forest Regression (MSE: 1.5923508e-05) and the Neural Network (MSE: 7.0015085e-05), which we built using TensorFlow. These performed an order of magnitude better than our other models which were all in the range of (e-03<MSE<e-04).
Conclusion
A major insight we gained into the UN Data API was the issue of self-reporting, as it creates a pattern of significant under-reporting from some countries while others consistently report all values. We also discovered that Hard Coal serves as the largest indicator of Greenhouse Gas Emissions, with higher levels of correlation than any other fossil fuel. In addition, we also found that production of any energy source/fossil fuel is a much larger predictive factor for GHG emissions than imports or exports.
A wide variety of programming skills and technical knowledge were gained through this mission, such as training machine learning models and gathering and manipulating data. In addition, we were able to practice other soft skills such as presenting and public speaking. As we plan for our next mission, we hope to implement these skills to gain a better understanding of new data and trends to help us overcome whatever obstacles we may face.
Mission: Complete
Success
Team
Meet the extraordinary Gravity Wells Team, led by Special Agents Ethan Hunt and Ian Wu